Blog Post 2
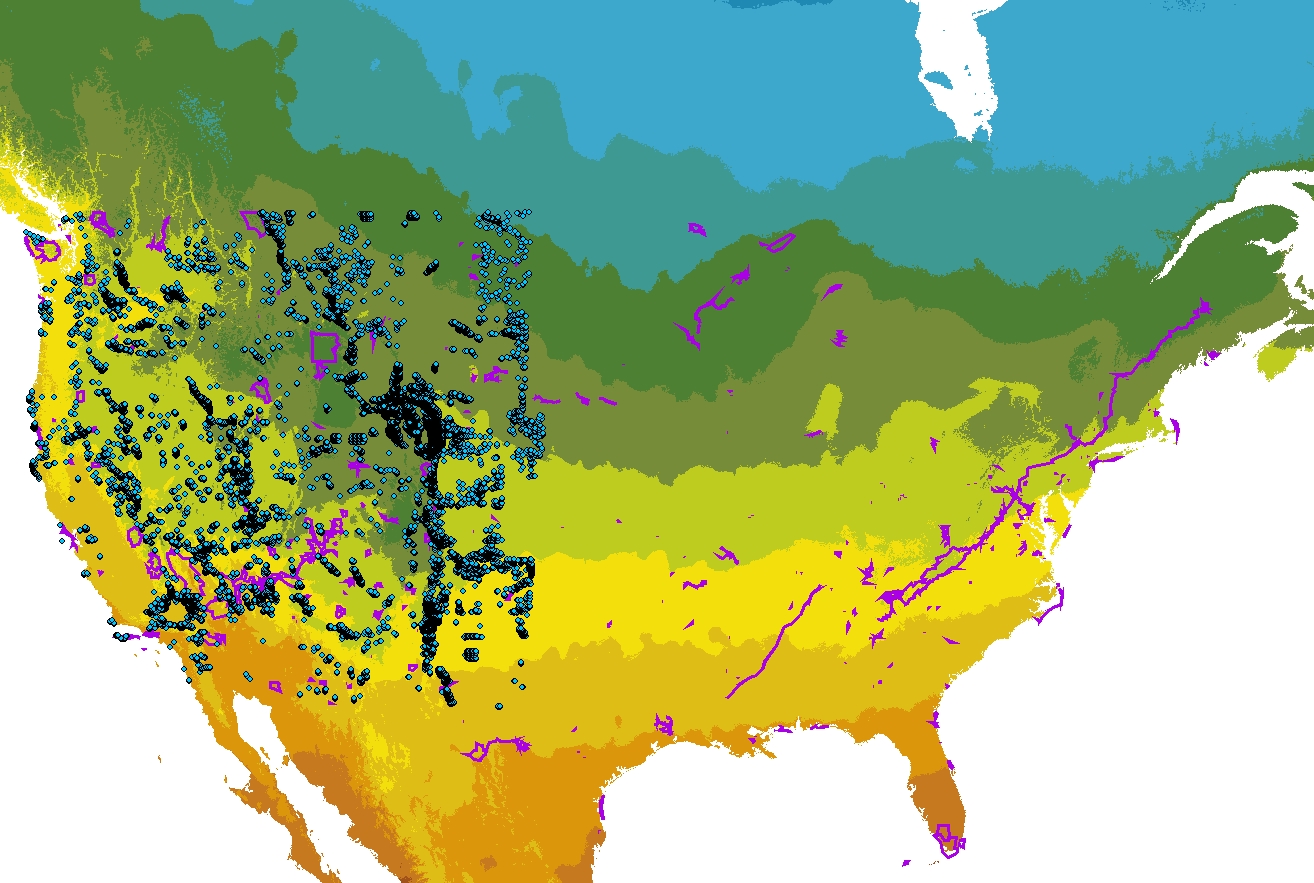

This week for my project I worked on importing data. The first map shows the national park boundaries, western wind averages, and average monthly temperature data for the United States. The second map shows the national park boundaries, western wind averages, and annual precipitation data for the United States. I also added a state boundaries layer, but have to figure out how to show this on top of the other layers because it was showing up under the other layers.
Next, I plan to work on using the clipping tool or completing a query to show only the western United States. I will need to do this for each of my layers specifically so only the western United States data is shown. I also plan to figure out how many different maps I will be using to show wildfire hazard potential. As of right now, I have two because I have to be able to show two different rasters. Lastly, I plan to figure out how I will be analyzing my data in order to calculate wildfire hazard potential surrounding each National Park in the western United States.
Problems that I have run into include importing data from ArcGIS Online. For some reason, I was not allowed to import certain data sets, but other data sets worked fine. I have worked around this by finding an online data source instead. I have also had problems with interpreting the western wind data set which is shown on both of my graphs above.
Hey Lexie, these look really great so far! With the state boundary data, have you tried going to the list button to the far left on the top of the table of contents bar, clicking that to change to the view where you can click and drag a layer to move it abve another one? It sounds like you have a really strong plan in place, keep up the good work!
ReplyDeleteYou're off to a great start Lexie and making awesome progress already. Nice use of the color rank with red being the higher levels of precipitation! Will you be layering the annual temperatures in the US with the annual precipitation or will you be keeping them as two separate maps? Nice job!
ReplyDelete